Contents
Monitor the health of your application infrastructure with Elasticsearch & Kibana

Elasticsearch is an open-source, distributed search and analytics engine that is commonly used for log analytics, full-text search, and operational intelligence. Kibana is a free open-source data visualization tool that provides a tight integration with Elasticsearch and is the default choice for visualizing data stored in the latter.
How They Work Together
Data is sent to Elasticsearch in the form of JSON files via the Elasticsearch API or other ingestion tools such as Logstash or Amazon Kinesis Firehose. Elasticsearch then proceeds to store the document and adds a searchable reference to the document in the cluster’s index which can be retrieved using the Elasticsearch API. This data stored in Elasticsearch can be used to easily set up dashboards and reports with Kibana to gain access to analytics and additional operational insights.
“The ability to make sense out of data is no longer simply a competitive advantage for enterprises, it has become an absolute necessity for any company in an increasingly complex and statistics-driven world. The visualizations provided by Kibana on Elasticsearch data can quickly provide deep business insight.”
— Brad Winett, TrackIt President
Helping ElephantDrive Take Advantage of Kibana Dashboards to Better Monitor their APIs
ElephantDrive is a leading service supplier that provides individuals and businesses simple but powerful tools for protecting and accessing their data. With ElephantDrive, ordinary people enjoy the peace of mind that comes from the type of enterprise-class backup, storage, and data management that has historically only been available to big corporations.
ElephantDrive wanted to improve its ability to store, analyze, and visualize log information, so they set up a basic ELK (Elasticsearch, Logstash, Kibana) stack. The initial Kibana implementation was in place but without any of the dashboards that make it such a valuable tool, so ElephantDrive approached the TrackIt team and asked us to analyze ElephantDrives’s current Elasticsearch logs to recommend dashboards that could be set up to allow for better log monitoring. Two were created for this specific purpose:
- A ‘data.operation’ dashboard that displays the distribution of requests by operation in a pie chart
- A ‘data.apiKey’ dashboard that displays the average response time per API key
“We were able to get the basic stack up quickly, but wanted to turn the data into actionable information — the Track It team not only helped us leverage the power of Kibana’s visualizations, but also provided the education, documentation, and tools for us to take the next steps on our own”
— Michael Fisher, ElephantDrive CEO and Co-Founder
The following is a thorough tutorial that will first walk the reader through the general process of setting up dashboards using Elasticsearch and Kibana before illustrating the steps we took to set up these two dashboards for ElephantDrive.
Accessing Elasticsearch & Kibana
Communication with Elasticsearch is done via HTTP requests. We have used Postman in this example, which provides us with a more graphical interface to make requests. To access Elasticsearch, you can make requests in the following way using a curl in a shell script:
curl -v “http://ec2-XXX-XX-X-XX.compute-1.amazonaws.com:9200/_cat/indices?v”
To access Kibana, load this URL in your browser :
http://ec2-XXX-XX-X-XX.compute-1.amazonaws.com:5601
Logstash Ingestion Issue & How To Fix It
ElephantDrive had an issue with their Logstash. Under some rare circumstances, the Logstash ingestion was failing and the following error message was received:
[2020–03–04T22:34:52,349][WARN ][logstash.outputs.elasticsearch] Could not index event to Elasticsearch. {:status=>400, :action=>[“index”, {:_id=>nil, :_index=>”logstash-2020.03.04", :_type=>”doc”, :_routing=>nil}, #<LogStash::Event:0x16a5ee83>], :response=>{“index”=>{“_index”=>”logstash-2020.03.04", “_type”=>”doc”, “_id”=>”AXCnr_f9Ski653_WeeEo”, “status”=>400, “error”=>{“type”=>”mapper_parsing_exception”, “reason”=>”failed to parse [data]”, “caused_by”=>{“type”=>”illegal_state_exception”, “reason”=>”Can’t get text on a START_OBJECT at 1:171"}}}}}
This error was thought to be coming from a malformed log entry arriving at the exact moment a new Elasticsearch index is created. This would happen if the malformed log entry is the first one sent to Logstash on a new day since Logstash creates a new index each day.
Since the Elasticsearch mapping is dynamically created from the message parsed by Logstash, a malformed message will put a wrong mapping in the index, which will, in turn, stop the correct message from being ingested.
Fixing the Logstash Ingestion Issue
If you are facing a similar issue, the first step to take is to shut down Logstash. Once Logstash is shut down, you need to delete the incriminated index. The index name can be found in the Logstash log (and is typically “logstash-YYYY.MM.DD”).
Open Kibana, and go to “Dev Tools”:
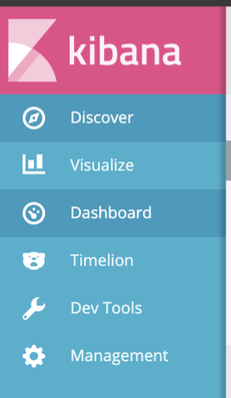
Delete the index with the following command (using the name of the incriminated index) :

You can then restart Logstash and let it ingest new log entries.
Once Logstash has recreated the index, you will also need to refresh the field list to get the correct mapping (under Management > Index Pattern > logstash-*) :

Getting Started With Kibana
How To Create A Dashboard with Kibana — Pie Chart Example
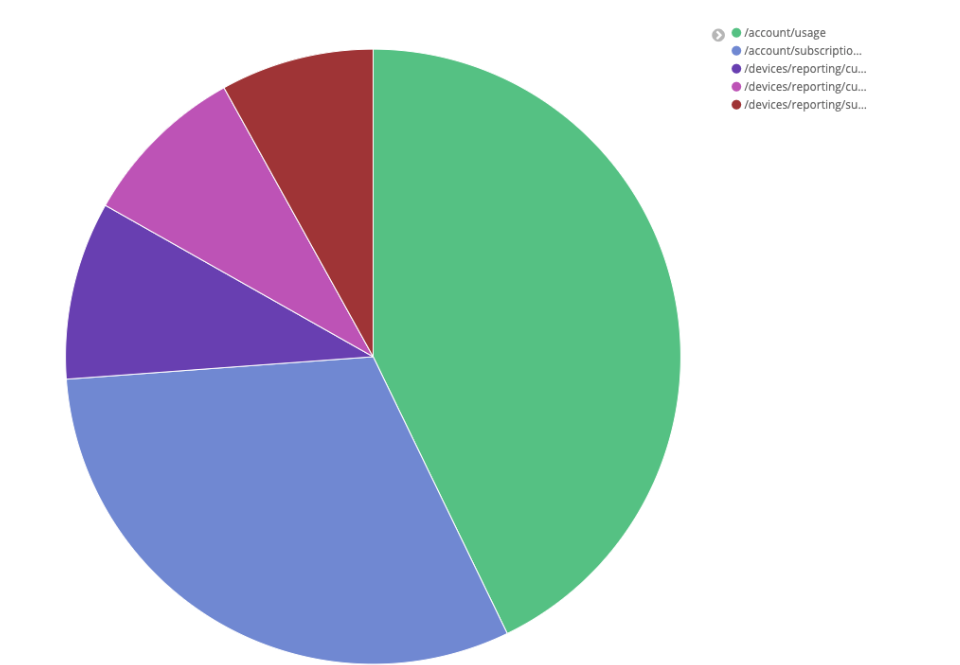
In this initial example, we will walk you through the process of creating a pie chart dashboard that shows the most performed queries.
- Go to the “Visualize” tab and click the “Create new visualization” button

- Select “Compare parts of a whole” (Pie chart)

- The data required to create this dashboard is located in the “logstash” database.

- Select “Split Slices”
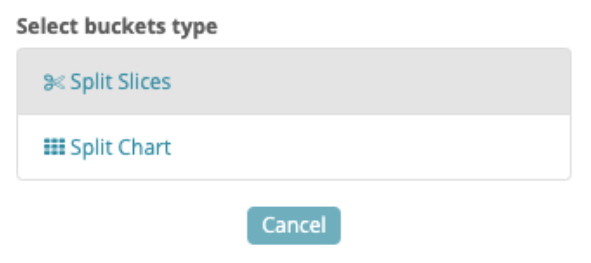
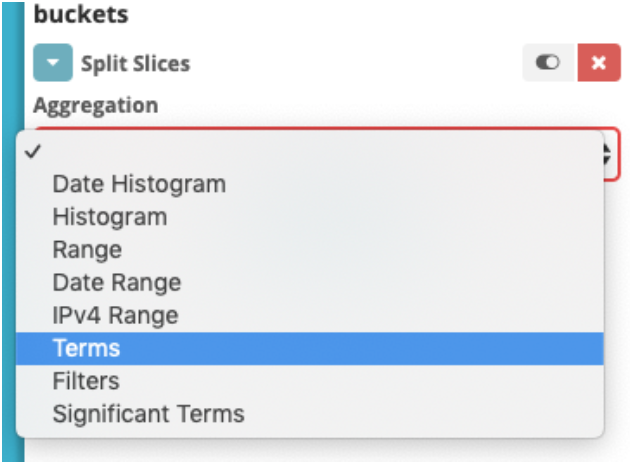
- Under “Aggregation”, choose “Terms”
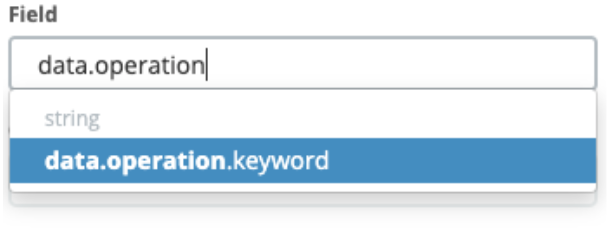
- Select “data.operation.keyword”
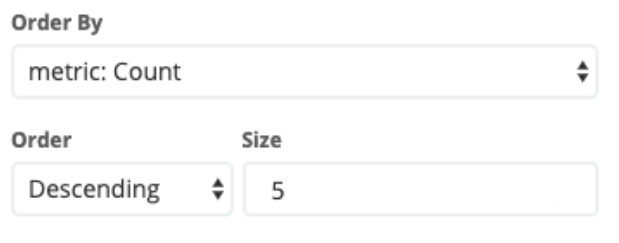
- Choose how you would like to order the dataand alsothe number of slices with “Size”
- Click on “Apply changes”

This is what the result looks like:
Creating the ‘Average response time per API Key’ Dashboard
The first dashboard we created for ElephantDrive is a data table that displays the average response time per API key. The steps to implement this dashboard are as follows:
- Go to the “Visualize” tab and click the “Create new visualization” button

- For this type of data, choosing “Data Table” is a relevant choice.

- The data required to create this dashboardis located inthe “logstash” database.

- Now we need to add a row for the API keys, so under “select buckets type”, choose “Split Rows”

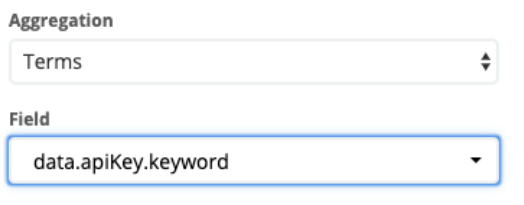
- To find API keys, choose Terms under “Aggregation” and choose data.apiKey.keyword under “Field”
- To add the average response time per API key to the data table, click on “Add metrics” under “metrics”

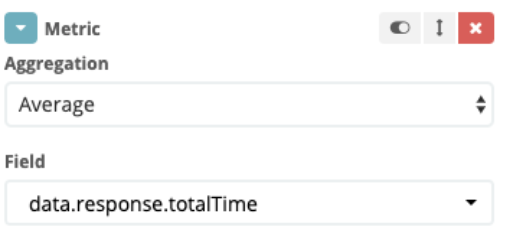
- Under “Aggregation” choose Average, and under “Field” choose data.response.totalTime
- Click on “Apply changes”. We now have a dashboard that shows us the average response time per API key:

Creating the ‘Average time per operation’ Visualization
The second dashboard we created for ElephantDrive displays the average time elapsed (in ms) by operation type. The steps to implement this dashboard are as follows:
- Go to the “Visualize” tab and click the “Create new visualization” button

- For this type of data, choosing “Vertical Bar” is a relevant choice.

- The data required to create this dashboardis located inthe “logstash” database.

- We first want to see the average time, so in the “metrics” section choose “Average” in Aggregation and “data.response.totalTime” in Field.
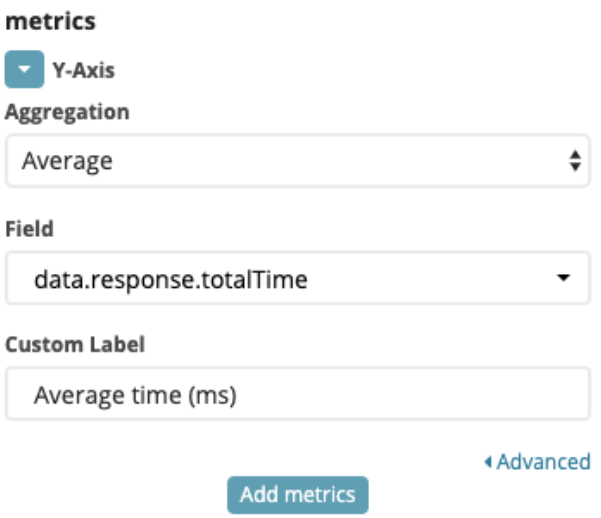
- Then we want to add a metric

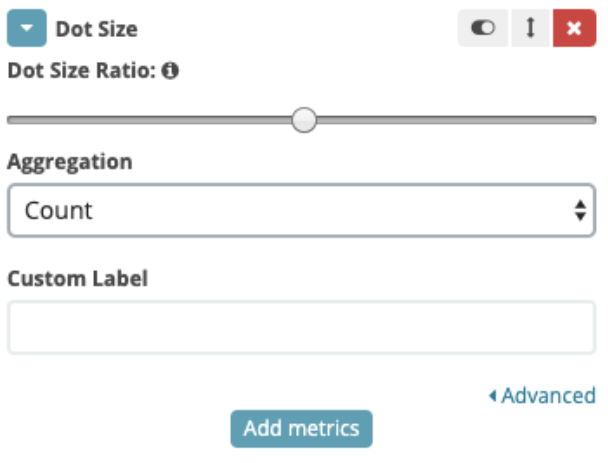
- Select “Dote Size”

- And select “Count” as Aggregation, to be able to see how many times the query has been used.
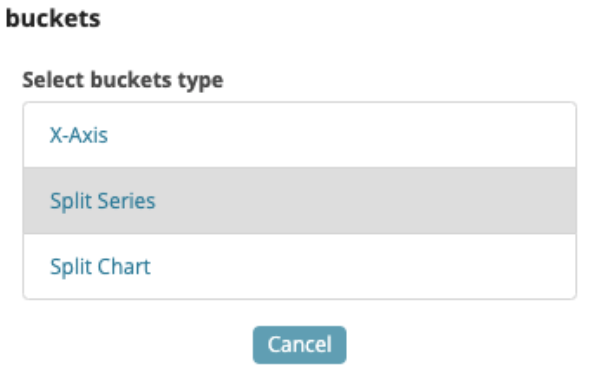
- Now, to see which method is used (GET, POST, PUT, etc..) wehave togo in the Bucket section, and choose “Split Series”
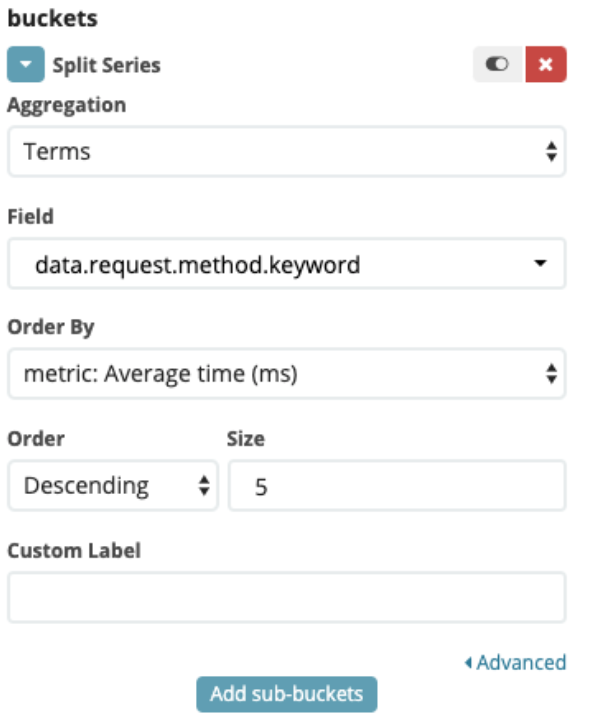
- And then “Terms” as Aggregation, “data.request.method.keyword” as field, and Order By “Average time” (created step 4)
- Finally, to see where the operation has been made, we will add a sub-bucket

- And create a “Terms” Sub Aggregation, with “data.operation.keyword” as Field
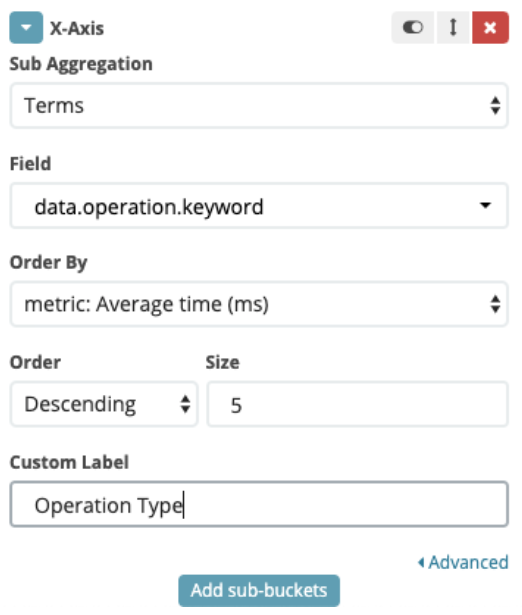
There you have it!
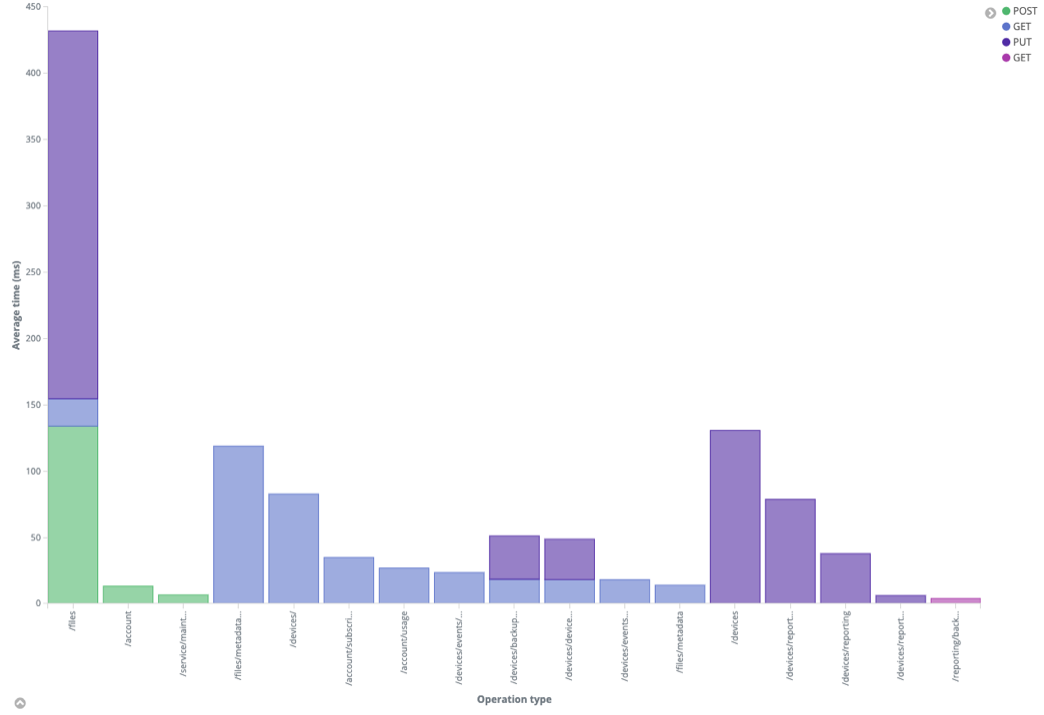
And you can see more details by hovering over a section with your mouse

Better Visibility & Enhanced Productivity In Log Monitoring
Cloud based infrastructure can sometimes feel like a black box with only limited visibility into its efficiency. Utilizing Kibana and Elasticsearch provides ElephantDrive with informative dashboards that provide insight into their compute environment, enhancing the efficacy of their log monitoring efforts.
About TrackIt
TrackIt is an international AWS cloud consulting, systems integration, and software development firm headquartered in Marina del Rey, CA.
We have built our reputation on helping media companies architect and implement cost-effective, reliable, and scalable Media & Entertainment workflows in the cloud. These include streaming and on-demand video solutions, media asset management, and archiving, incorporating the latest AI technology to build bespoke media solutions tailored to customer requirements.
Cloud-native software development is at the foundation of what we do. We specialize in Application Modernization, Containerization, Infrastructure as Code and event-driven serverless architectures by leveraging the latest AWS services. Along with our Managed Services offerings which provide 24/7 cloud infrastructure maintenance and support, we are able to provide complete solutions for the media industry.

