Teradici CAS (Cloud Access Software) now HP Anyware and AWS Thinkbox Deadline are two essential services used in the implementation of a Studio in the Cloud (SIC) on AWS. Teradici CAS is a high-performance remote desktop solution that offers robust capabilities for remote access and allows users to securely connect to virtual workstations. AWS Thinkbox Deadline is a render management service that provides studios with a powerful system for managing and distributing rendering tasks across a fleet of virtual machines.
Ensuring the consistent performance of Teradici CAS and Deadline is crucial in a SIC environment, and why monitoring is so important. Monitoring tools proactively identify issues, enhance resource management, and facilitate informed decision-making.
Below are the benefits of implementing monitoring tools for Teradici CAS and AWS Thinkbox Deadline in a Studio in the Cloud (SIC) environment. Insights are provided into the selection and implementation procedures for setting up monitoring tools, collecting metrics, and visualizing them in charts or dashboards.
Contents
Benefits of Monitoring
1. Optimized Performance
Monitoring tools offer real-time insights into the health and performance of Teradici CAS and Deadline services. Continuous resource monitoring allows administrators to locate bottlenecks, improve system responsiveness, and provide a seamless user experience.
2. Proactive Issue Identification
Early detection of errors and anomalies that could disrupt operations are a critical component of monitoring tools. By tracking metrics and setting up alarms, administrators can promptly address issues, minimize downtime, and ensure ongoing productivity.
3. Resource Management
The usage of Teradici CAS and Deadline services often involves complex resource allocation. Monitoring tools enable administrators to track resource usage, identify underutilized or overutilized resources, and make data-driven decisions to optimize resource allocation and control costs.
Selecting and Implementing Monitoring Tools
Collection of Metrics for Teradici CAS
The serverless architecture for monitoring Teradici CAS integrates multiple services (AWS Lambda, Amazon EventBridge, Amazon CloudWatch, and Teradici Manager API) to collect and track metrics from the Teradici Manager API in an automated and scalable manner.
AWS Lambda, a serverless compute service that enables running code without the requirement for server management, resides at the center of this architecture. A Lambda function that collects metrics from the Teradici Manager API is triggered by EventBridge based on specific events or a schedule.
The Teradici Manager API serves as the source of metrics for the Teradici CAS deployment. The metrics that can be retrieved from the Teradici Manager API include the following:
- Current health check status of the manager
- Current health check status of all connectors
- Current number of workstations in the studio
- Current number of workstations in a non-stopped state
Once the metrics have been collected, the Lambda function pushes the data to Amazon CloudWatch, an advanced monitoring and observability service provided by AWS. CloudWatch serves as a centralized repository for storing and analyzing the gathered data, and provides the visualization of the collected metrics, setting of alarms, and performing in-depth analysis of collected data.
CloudWatch Agent
The CloudWatch agent can be used to automatically collect metrics on CPU, RAM, and disk usage from workstations (PCoIP clients) for comprehensive monitoring and analysis. The installation and configuration of the CloudWatch agent can be achieved with the assistance of a PowerShell script. This script streamlines the process by initially downloading the agent installation package from a predetermined source and proceeds to install the agent on the workstations.
Following the installation, the PowerShell script further configures the agent by generating or modifying the agent configuration file. Within this file, the specific metrics to be gathered (such as CPU, RAM, and disk usage) are explicitly defined. Upon completing the configuration, the script initiates the CloudWatch agent, thereby enabling the reporting and collection of metrics.
Integrating this PowerShell script into the deployment and configuration workflow allows users to streamline the process of installing and configuring the CloudWatch agent. This ensures consistent and automated metric collection from PCoIP clients that facilitates effective monitoring of the environment.
Visualizing Metrics to Monitor SIC Health
Collected metrics are visualized either on the CloudWise MSP Portal or on Grafana dashboards to assist in monitoring the health of an AWS Studio in the Cloud (SIC) environment.
ClouidWise MSP Portal – Monitoring Teradici CAS
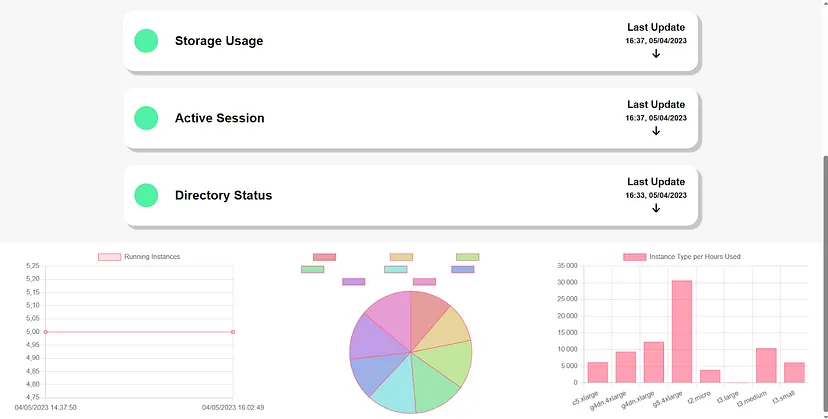
The CloudWise Managed Services Provider Portal (MSP Portal) is a comprehensive platform designed by TrackIt that allows users to monitor Teradici CAS health. One of the key functionalities of the portal is the ability to provide real-time monitoring of infrastructure using CloudWatch alarms.
The portal helps establish pre-defined CloudWatch alarms to ensure vigilant monitoring of critical aspects such as billing, bucket hours, and active directory status. These alarms play a vital role in the proactive identification of anomalies that arise in a SIC environment.
In addition to alarm monitoring, the portal provides charts that visually represent data collected from monitored infrastructure. These charts offer valuable insights into the system’s performance and allow administrators to ensure consistent Teradici CAS performance.
Line Chart
The line chart is available on the CloudWise MSP Portal and displays the number of running EC2 instances for the current day. This chart tracks the fluctuations in EC2 instances and allows admins to identify any discernible patterns or trends in infrastructure usage for optimal resource allocation.
Pie Chart
Data can also be displayed as a pie chart in the portal, and this provides a comprehensive breakdown of the hours used by individual Teradici users. It also enables admins to identify high-utilization users and allocate resources accordingly.
Bar Chart
A bar chart is also available to display the hours used for each EC2 instance type. This chart helps analyze the distribution of resource utilization across various instance types. Identifying the most and least utilized instance types allows administrators to make informed decisions regarding resource choice, allocation, and cost optimization.

CloudWise MSP-Portal Charts
Grafana Dashboards – Monitoring Thinkbox Deadline
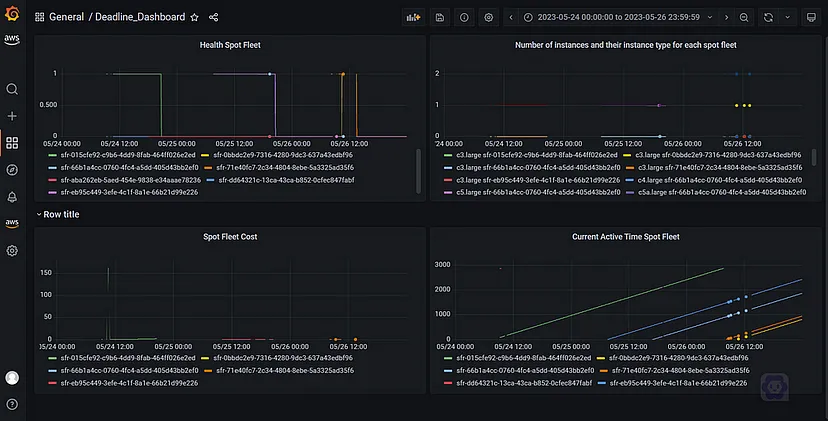
To collect and monitor metrics for Deadline Spot Fleet requests, it is recommended to use a serverless architecture incorporating AWS Lambda, Amazon EventBridge, and Amazon CloudWatch. The following Deadline metrics are collected:
- Current status of Spot Fleet
- Number of instances and their respective instance types within each Spot Fleet
- Active time of the Spot Fleet
- Health check status
- Associated costs
Lambda functions are used to collect these metrics from the Spot Fleet API. The collected metrics are then pushed to Amazon CloudWatch, where they are stored in a structured manner to allow for easy retrieval and analysis.
Amazon Managed Grafana, a scalable data visualization service that integrates seamlessly with CloudWatch to visualize the collected metrics. Using Grafana, dynamic and customizable dashboards are created for real-time, actionable insights into the Spot Fleet metrics.

Spot Fleet metrics visualized on Grafana
Conclusion
Monitoring tools can play a crucial role in ensuring consistent AWS Studio in the Cloud performance. By leveraging services such as TrackIt CloudWise, AWS Lambda, Amazon CloudWatch, and Amazon Managed Grafana, metrics from Teradici CAS and Deadline can be gathered and displayed in customized charts and dashboards. These monitoring tools help oversee and maintain the health of SIC environments in real time.
About TrackIt
TrackIt is an international AWS cloud consulting, systems integration, and software development firm headquartered in Marina del Rey, CA.
We have built our reputation on helping media companies architect and implement cost-effective, reliable, and scalable Media & Entertainment workflows in the cloud. These include streaming and on-demand video solutions, media asset management, and archiving, incorporating the latest AI technology to build bespoke media solutions tailored to customer requirements.
Cloud-native software development is at the foundation of what we do. We specialize in Application Modernization, Containerization, Infrastructure as Code and event-driven serverless architectures by leveraging the latest AWS services. Along with our Managed Services offerings which provide 24/7 cloud infrastructure maintenance and support, we are able to provide complete solutions for the media industry.

