Set Up a TrackIt Account
Our team developed TrackIt to help organizations better understand their AWS cloud deployment. Our interactive platform offers insights into cloud operational metrics through a variety of charts including utilization (CPU, bandwidth, I/O) of different instances. With your cloud infrastructure delivering optimal performance, you can focus on what really matters: creating innovative solutions for you customers.
To start enjoying the benefits of TrackIt, create a TrackIt account and sync your cloud deployment. You can find the step-by-step account setup in the video below:
https://www.youtube.com/watch?v=iq4eFbTn5oc&t=130s
You can also find a full account setup guide here: https://trackit.io/#/app/setupguide
Check Your Data
Once you successfully create your TrackIt account and sync your cloud keys, TrackIt will display your data in graphs that are easy to read and understand. Your data will be taken directly from your cloud console to give you the most accurately summarized charts and break down your cost and usage of different instances from all the cloud platforms.
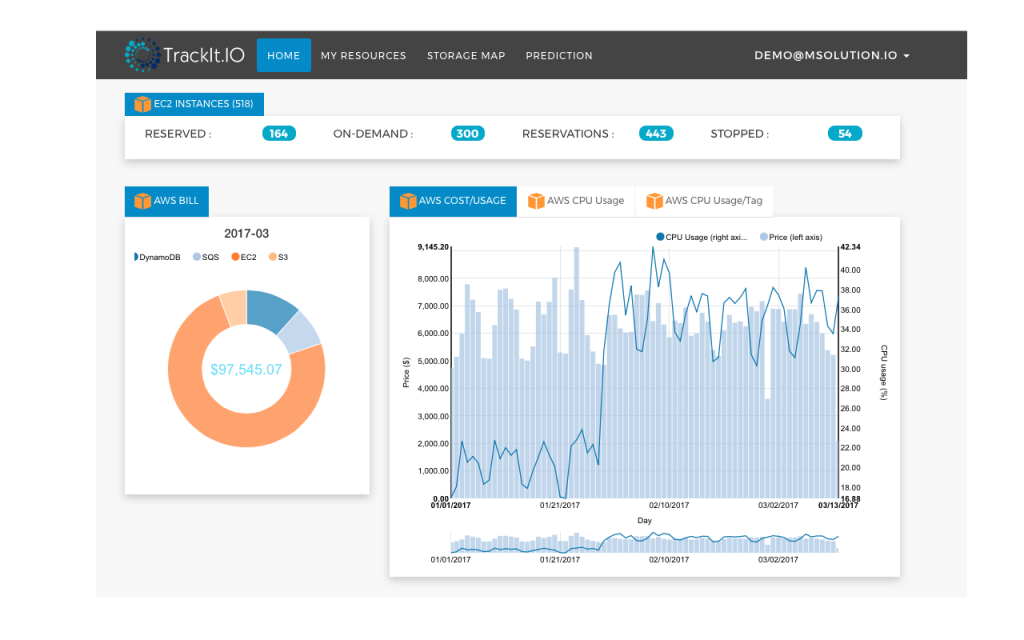
The Home page will feature the current state of your computing instances (running reserved, on-demand, total number of reserved instances, and stopped). The left panel will display a pie chart of your total cloud bill monthly charges. This pie chart features the most up-to-date information for your cloud deployments, and if you have synced keys for more than one cloud console, each console (AWS, GCP, Azure) will be displayed in a separate tab, allowing you to look at how much you are spending on each deployment. The right panel will display a mixed line and bar graph to showcase your cost per CPU usage. A total of three months (the current month and the two preceding months) are featured in the Cost/Usage graph, allowing you to follow any usage trends and patterns. The Cost/Usage graph also features multiple tabs, allowing you to see the CPU utilization and their respective costs for each of your cloud deployments (AWS, GCP, Azure).
The next page is My Resources page, this is the most detailed page in TrackIt. There are multiple tabs featured within the “My Resources” page, which gives you deep insight into your operational metrics.
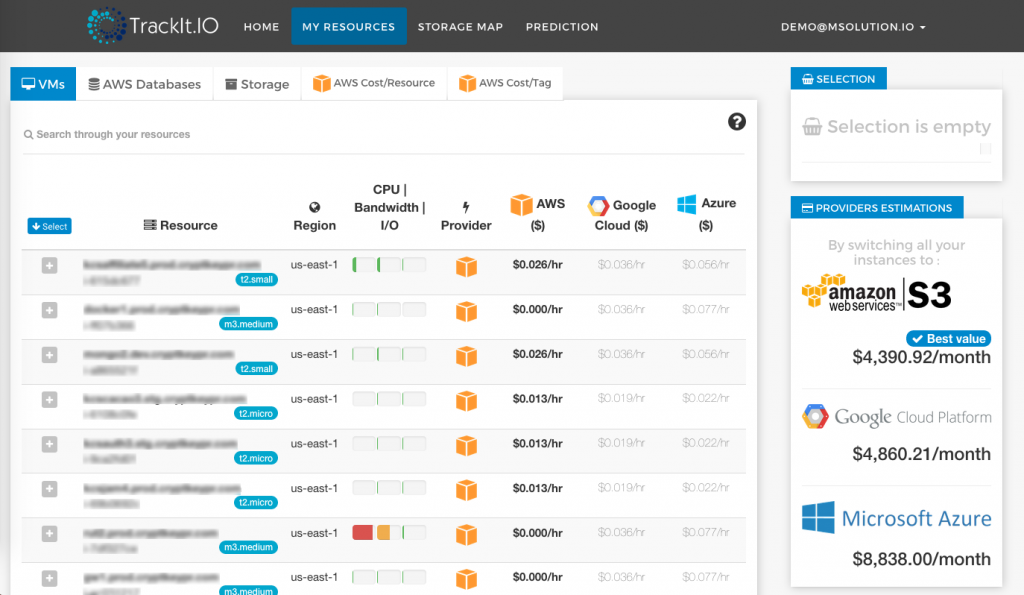
The VMs tab allows you to see all your virtual machines that have been deployed across all your cloud providers. It features details such as the region of deployment, resource utilization (I/O, Bandwidth and CPU), provider and current cost, and a cost comparison against the other providers.
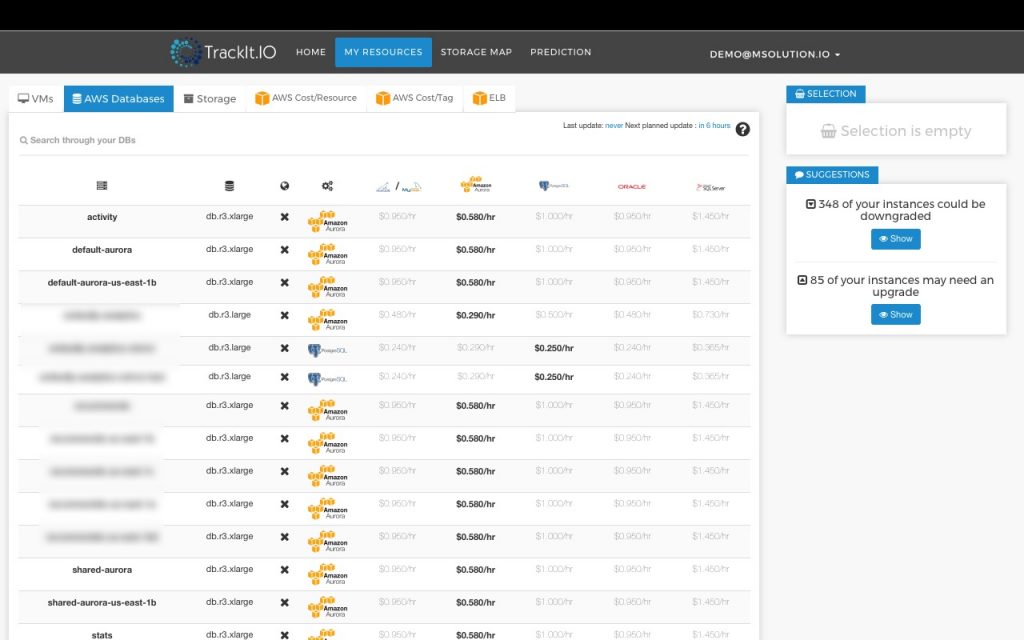
The Databases tab provides a complete list of the databases that are deployed across all the cloud providers. The information listed includes the resource name, the size/type of database, whether the database features multi-availability zone, the engine, the current cost, and a cost comparison against the other available providers.
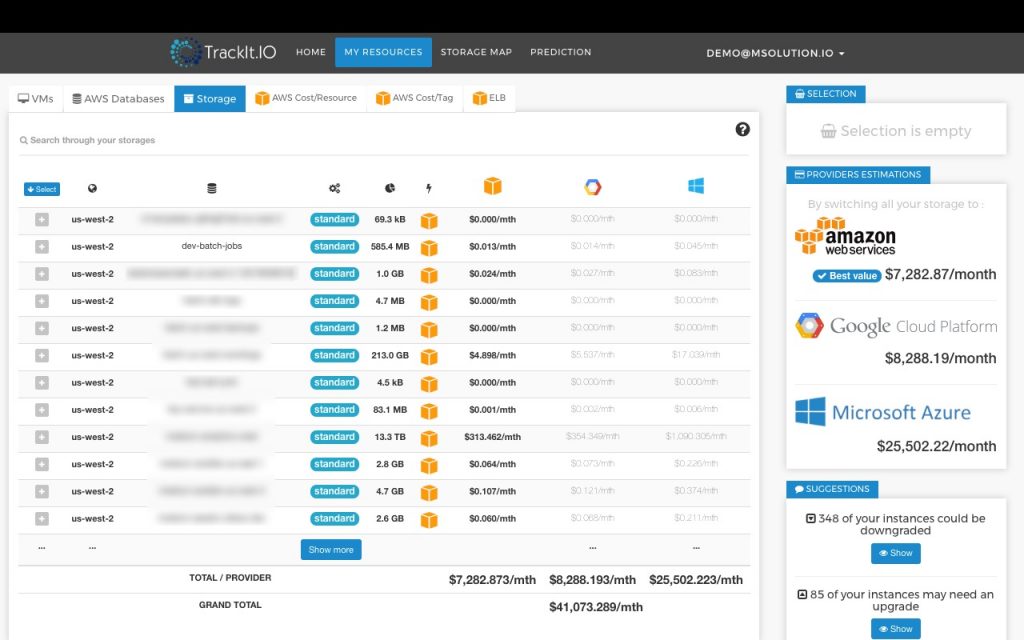
The Storage tab provides a list of storage buckets across all your cloud providers. The information listed includes bucket location, name, storage type (standard, infrequent access, archive), total used space, provider, the current cost, and a cost comparison against the other two available providers.
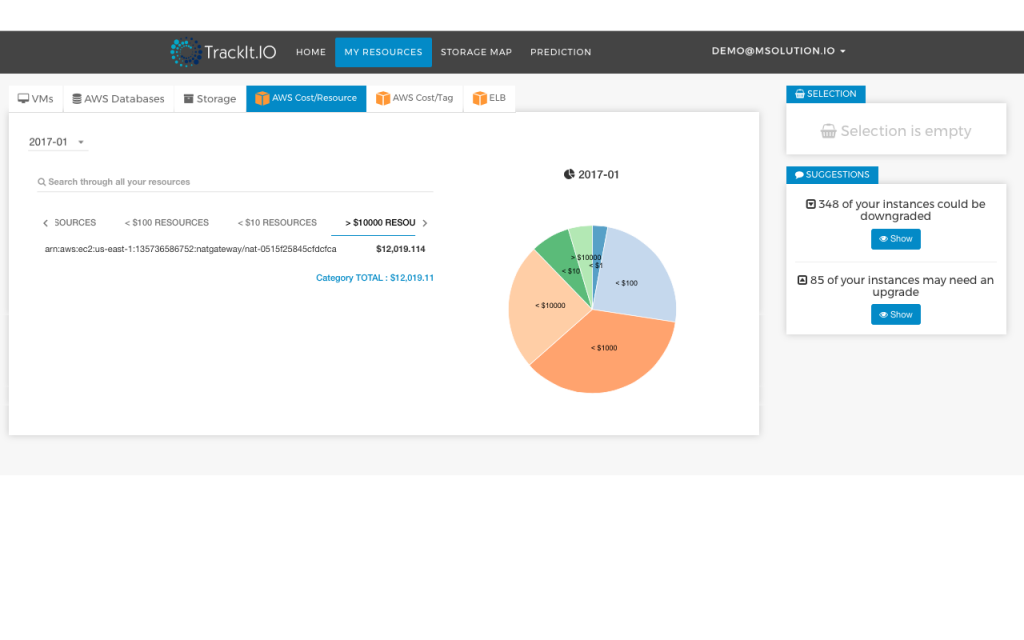
The Cost/Resource tab shows all the resources grouped based on the cost. This allows easy visualization of least expensive and most expensive resources. The available categories to group these resources are resources that cost: <$100, <$10, <$1, and >$100.
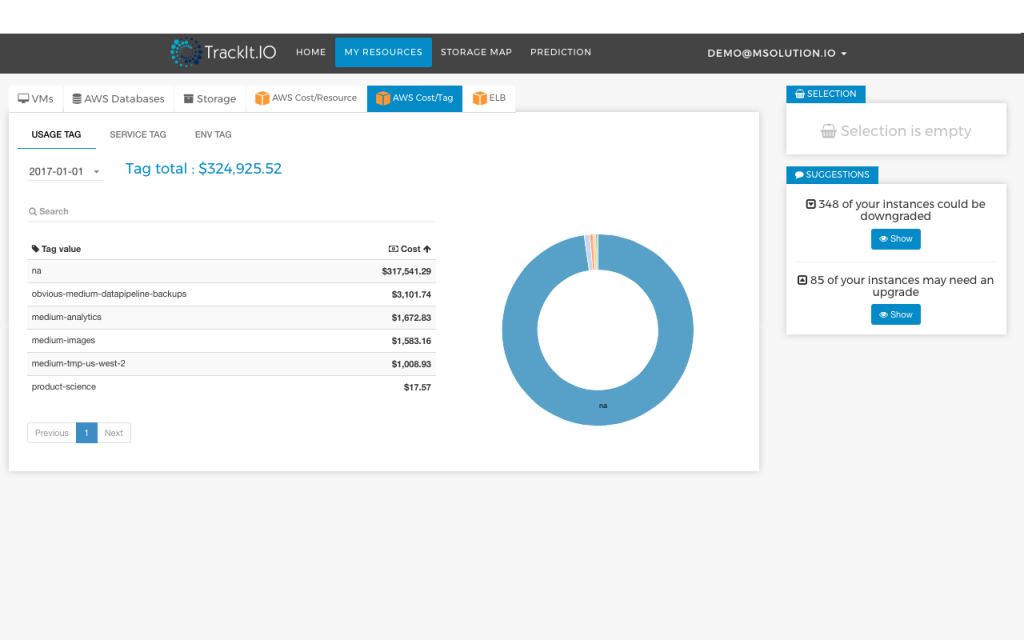
The Cost/Tag tab shows resources by their given tag and the total cost per tag category. The information is then displayed in a pie chart, providing better visualization of money spent on each tag. This is important because tags are basically a representation of a group, BU, project within an organization.
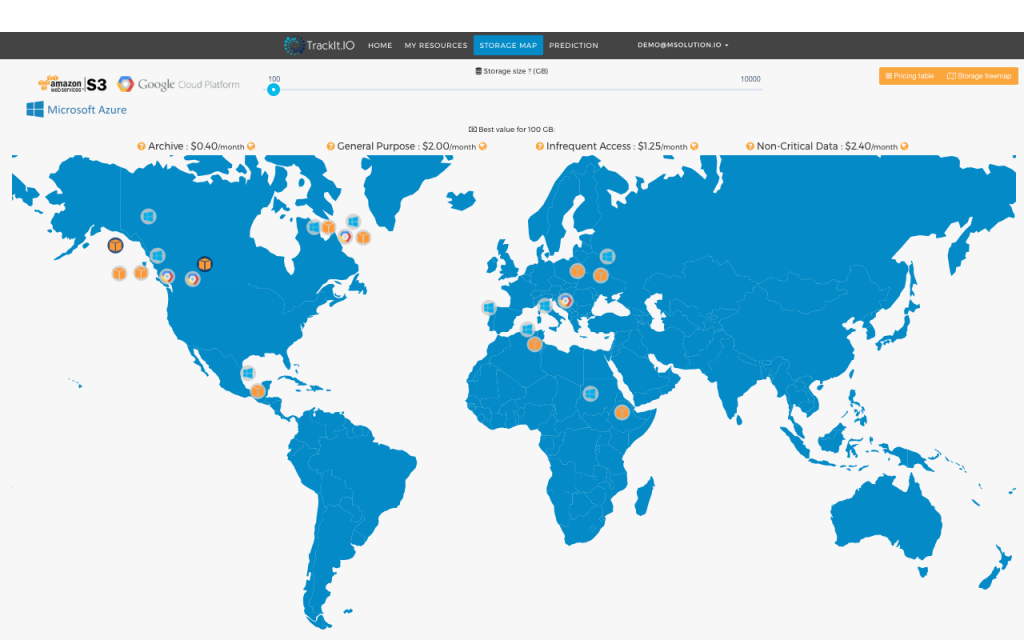
The Storage page displays a world map with available storage regions across all providers. By hovering your mouse over a region of interest, a window displaying pricing details for each storage type and selected provider will appear on your screen. If you currently have data stored in a region you have selected, you will see your current storage space usage.
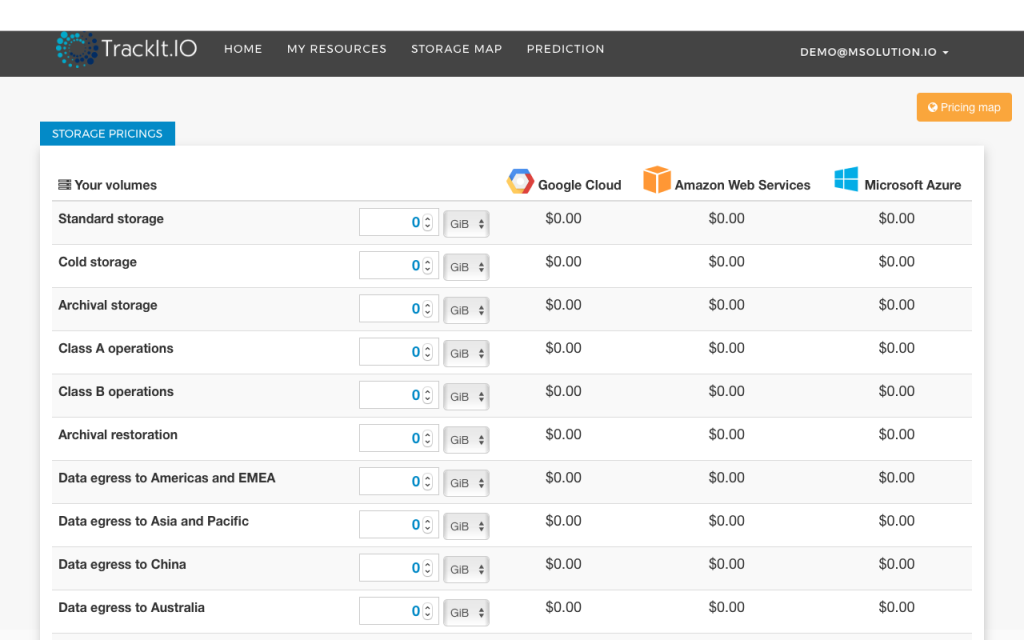
The next tab available within the Storage page is the Pricing Table. The pricing table acts as an advisory to decision makers when they are deciding to procure more resources on the cloud. They can see a real-time cost comparison across all the three providers (AWS, GCP and Azure) by just entering the desired storage amount.
Take Actions for Cloud Deployment
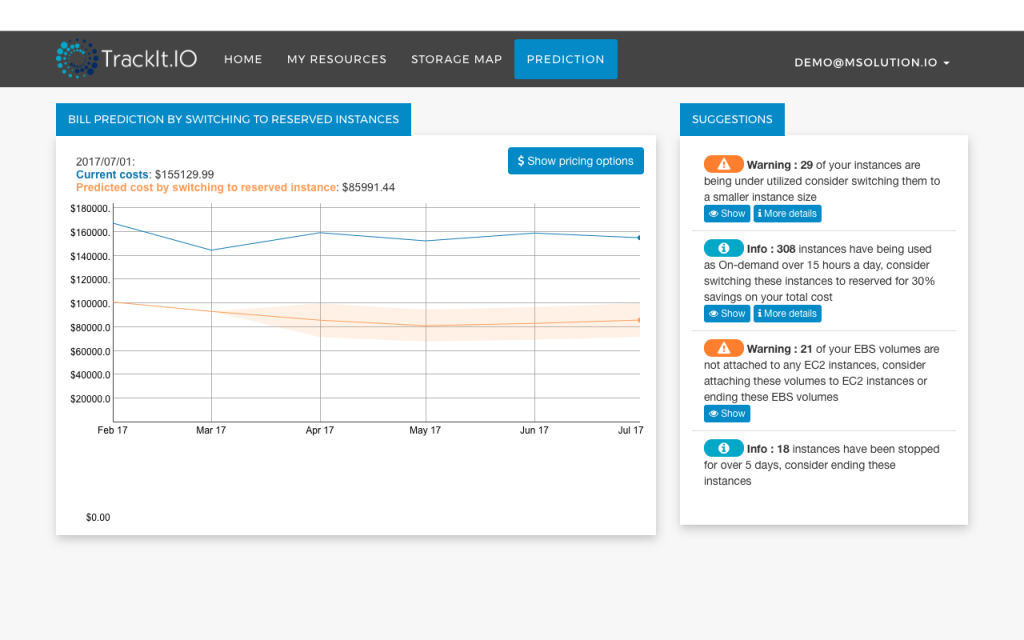
Now that you have seen how your cloud operates and its associated costs, what’s next? TrackIt makes it easy for you to turn your concerns into actions! In the Prediction page, TrackIt provides suggestions to optimize your resources on the cloud as well as money saving opportunities. The suggestions could include:
- Downsizing a computing instance if the utilization is well below capacity
- Shutting down AWS EBS Volumes if they are detached from EC2 instances
- Shutting down compute instances that have been stopped for more than specified number of days, and more!
TrackIt even displays a graph to compare current monthly bill with an estimate of future bills based on TrackIt’s recommendations. Explore TrackIt and learn how you can optimize your cloud deployment!
About TrackIt
TrackIt is an international AWS cloud consulting, systems integration, and software development firm headquartered in Marina del Rey, CA.
We have built our reputation on helping media companies architect and implement cost-effective, reliable, and scalable Media & Entertainment workflows in the cloud. These include streaming and on-demand video solutions, media asset management, and archiving, incorporating the latest AI technology to build bespoke media solutions tailored to customer requirements.
Cloud-native software development is at the foundation of what we do. We specialize in Application Modernization, Containerization, Infrastructure as Code and event-driven serverless architectures by leveraging the latest AWS services. Along with our Managed Services offerings which provide 24/7 cloud infrastructure maintenance and support, we are able to provide complete solutions for the media industry.

