Contents
About Bundle
In a world where balancing work and life can be a daily challenge, today’s employees require personalized support.
Bundle stands out as the premier 1:1 live skill development solution, dedicated to human-centric skills. Bundle curates and delivers live content, facilitated by trained experts, designed to empower skill growth and enhance performance.
Bundle believes human-to-human live learning builds lasting skills. And we know that lasting skills build resilient organizations. The future of learning is human.
Bundle’s Solutions
The Need for Better Data Management
Bundle Benefits was looking for a solution that would enable its Customer Experience (CX) team to better manage data for booked sessions. The company was using a non-normalized Content Management System (CMS) database which made it challenging for the CX team to gather and use customer and session-related data. This left Bundle’s CX team with no choice but to follow a tedious process involving the exporting of all session data and later manually importing it into Excel spreadsheets.
To enable better data management and analytics, Bundle Benefits sought TrackIt’s help to implement an Extract, Transform, and Load (ETL) pipeline, a three-step interdependent process used to pull data from one database and move it to another, and a data warehouse along with analytics dashboards to help visualize this data.
“The CX team was half the reason why we wanted the data warehouse. They were losing a tremendous amount of time by having to manually enter data into Excel spreadsheets. The other major reason for the implementation was to be able to capture live data and implement live analytics dashboards.” – Tyler O’Connor, Data Analytics Lead, Bundle Benefits
“We wanted something that would allow different departments to see live analytics on their own and be able to track metrics that would enable better decision making. Basically, a solution that makes departments more independent and allows them to quickly pull data that they need when they need it.” – Tyler O’Connor, Data Analytics Lead, Bundle Benefits
Solution – ETL Pipeline and Data Warehouse
The TrackIt team implemented an ETL pipeline:
- Extract: Draw out structured and unstructured data from multiple sources. Raw data is injected into a staging environment.
- Transform: Data is normalized and refined to meet business and technical needs. All the data is stored in a curated S3 bucket to enable further data processing if necessary.
- Load: Loading data into the Data Warehouse built for Bundle’s use case. Essential data required for business analytics is loaded into the data warehouse, and all other data remains stored in the curated S3 bucket.
TrackIt leveraged AWS Lambda and Amazon S3 to implement the ETL pipeline. The team created a Lambda function for each of the three steps. Data coming from the main application and other sources enters the pipeline and is stored in different S3 buckets to ensure cost-efficiency. Once processed, the data is loaded into an Amazon Aurora MySQL data warehouse matching Bundle’s needs for scalability and efficiency.
TrackIt also implemented an Amazon CloudWatch event that triggers the Extract lambda function once every ten minutes to ensure automated extraction from the CMS database.
Dashboards To Visualize Data
TrackIt leveraged Tableau to implement three initial dashboards that would enable Bundle to visualize data collected from the ETL pipeline:
1. CX Dashboard
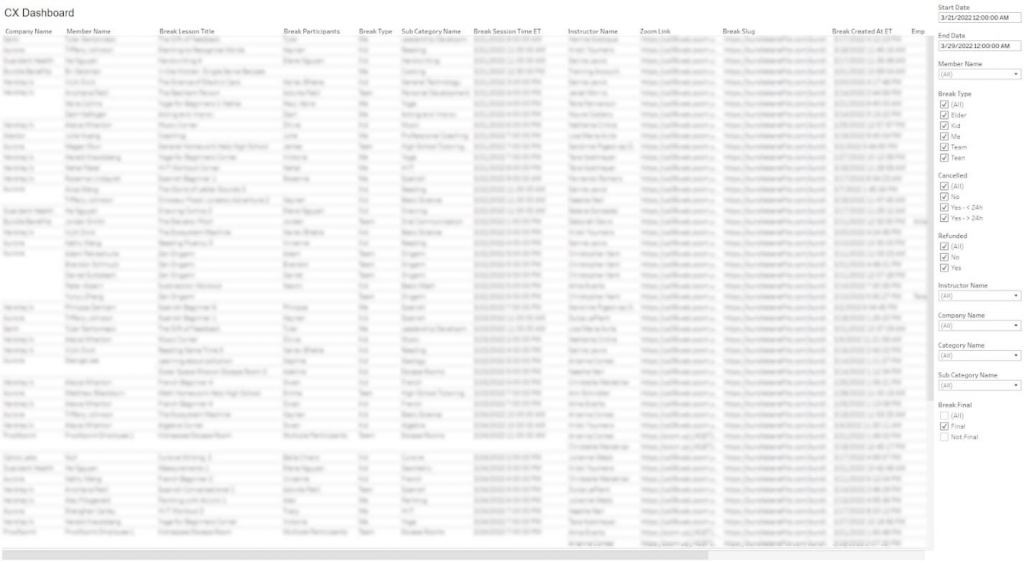
The CX dashboard is the primary dashboard used by Bundle. It has a filterable table with columns that display information on booked sessions such as session dates, instructor details, participant information, etc.

2. Pivot Table Dashboard
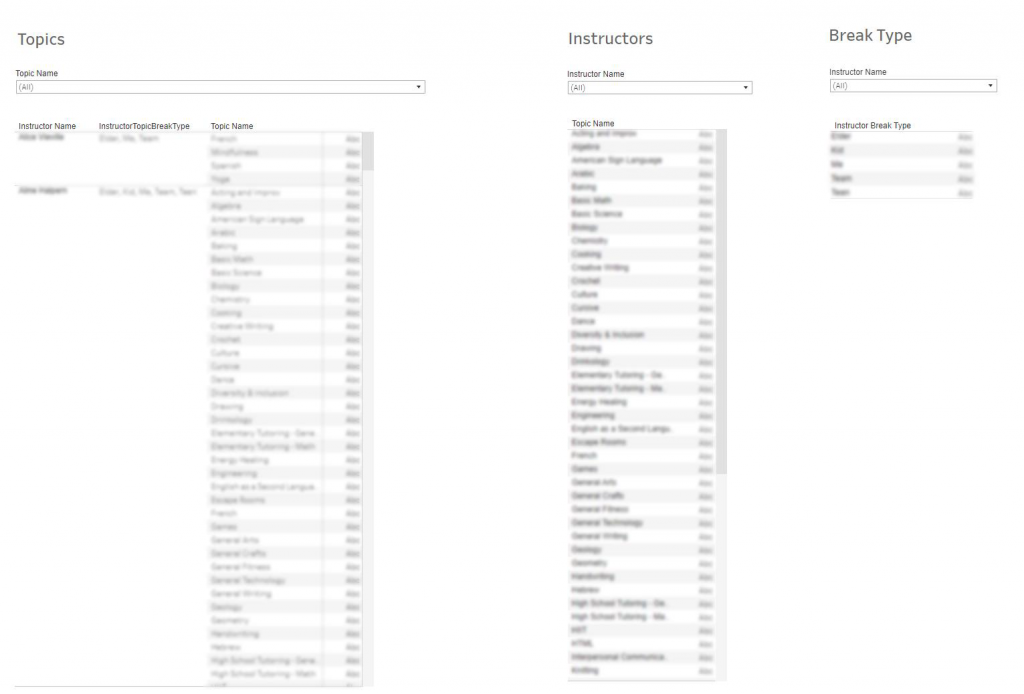
The pivot table dashboard consolidates information from the data storage created by the ETL process and displays instructor and session information in sortable tables.

3. Instructor Availability Dashboard
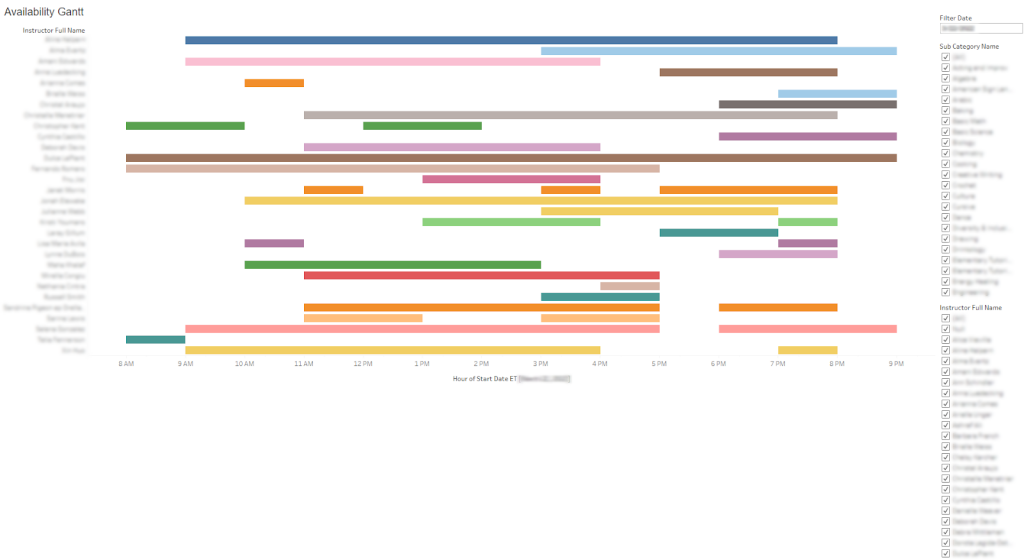
The Instructor Availability Dashboard displays Gantt charts that help visualize instructor schedules.


Results
The ETL pipeline and data warehouse implemented by TrackIt ensured that all the essential data was grouped in a single place and formatted in a consistent way to enable effective data analytics. The usage of CloudWatch also helped Bundle to realize time savings by automating the process of data extraction from the CMS database.
The dashboards implemented using Tableau are now assisting Bundle in visualizing data to improve productivity and enhance decision making.
TrackIt’s Expertise
Tyler O’Connor, Data Analyst Lead at Bundle praised TrackIt’s expertise, responsiveness, and commitment to Bundle. Tyler was particularly impressed with TrackIt’s patience during interactions with non-technical staff during the implementation.
Ensuring a Seamless Flow of Information Throughout the Organization
“The cohesiveness within the organization has improved thanks to the implementation of the data lake. There are fewer back-and-forths involving asking someone to check if they have the same numbers in an Excel spreadsheet as someone else. And personally, for me, making dashboards for other departments has been made significantly easier by having a data lake.”
– Tyler O’Connor, Data Analytics Lead, Bundle Benefits
Q. Qualities of the TrackIt team that stood out to you?
A. “The TrackIt team was very responsive to the needs we had. They were also very patient. When you are implementing something like this, it can sometimes feel like there’s a barrier when you’re trying to explain technical concepts. A lot of the people we have on our team aren’t data-centric, and the TrackIt team was very patient in making sure we understood what was being done.”
Tyler O’Connor, Data Analytics Lead, Bundle Benefits
Q. Would you recommend TrackIt to other companies? Why?
A. “Yes, I would. I think they did a very good job in terms of implementing this data warehouse. They did an exceptional job in terms of being patient with non-technical people. This was a very complicated project and the data in our company is very difficult to manage but the TrackIt team made sure that everyone was comfortable at each step of the implementation.”
Tyler O’Connor, Data Analytics Lead, Bundle Benefits
Challenge(s):
• Non-normalized CMS Database that made it difficult to gather and use customer data
• The need for dashboards to visualize data
Outcome(s):
• All essential data grouped in a single location
• Automated data extraction from CMS
• Data visualization enabling improved productivity and enhanced decision making
Solution(s):
• ETL Pipeline and Data warehouse built using AWS Lambda, Amazon S3, and Amazon Aurora
• Dashboards implemented using Tableau
About TrackIt
TrackIt is an international AWS cloud consulting, systems integration, and software development firm headquartered in Marina del Rey, CA.
We have built our reputation on helping media companies architect and implement cost-effective, reliable, and scalable Media & Entertainment workflows in the cloud. These include streaming and on-demand video solutions, media asset management, and archiving, incorporating the latest AI technology to build bespoke media solutions tailored to customer requirements.
Cloud-native software development is at the foundation of what we do. We specialize in Application Modernization, Containerization, Infrastructure as Code and event-driven serverless architectures by leveraging the latest AWS services. Along with our Managed Services offerings which provide 24/7 cloud infrastructure maintenance and support, we are able to provide complete solutions for the media industry.


