Contents
- About Qumulo
- Building A Sophisticated Cloud Calculator With A Simple User Interface
- Solution Architecture
- How The 3 Cluster Selections Are Provided
- Implementation Challenges
- Requirement Sliders
- The ‘Capacity’ Slider
- The ‘Performance’ Slider
- Implementation
- AWS Infrastructure Prices
- Challenge(s):
- Solution(s):
- Outcome(s):
- About TrackIt
About Qumulo
Qumulo is an enterprise data storage company based in Seattle, Washington. Founded in 2012, it provides companies with hybrid cloud file storage that delivers real-time visibility, scalability, and control of their data across both on-premises and cloud environments.
Qumulo’s enterprise-class, full-featured, scaleout NAS system meets the needs of scalability and performance for a multitude of demanding environments, making it one of the leading storage solutions available in the marketplace. Its software-defined storage architecture is also particularly appealing to companies looking to seamlessly transition back and forth between on-premise and cloud usage
Building A Sophisticated Cloud Calculator With A Simple User Interface
As Qumulo’s users started taking their first steps into cloud deployments, it became obvious that the process of selecting an appropriate solution required a new set of tools to help them build an optimal storage configuration for their particular needs.
Qumulo approached TrackIt to create a cloud calculator that would provide Amazon Web Services (AWS) users with accurate cost estimates for deploying their storage infrastructure on the AWS Cloud while also giving them the necessary flexibility to choose among options that conform to budget constraints while considering their capacity and performance requirements.
During the design phase, TrackIt suggested adding, and subsequently including, a one-button deployment of the selected solution in the user’s AWS environment with an automated AWS CloudFormation implementation.
The challenge of building the user interface for such a calculator was two-fold. On one hand, the interface had to be simple enough to be used by someone who was not a storage (or AWS for that matter) expert, but on the other hand, be able to handle the number of variables (namely Client Case Study: Qumulo Region, Capacity, Performance, Infrastructure, etc.) that were required to create the best suitable solution – introducing a certain degree of complexity to the design.
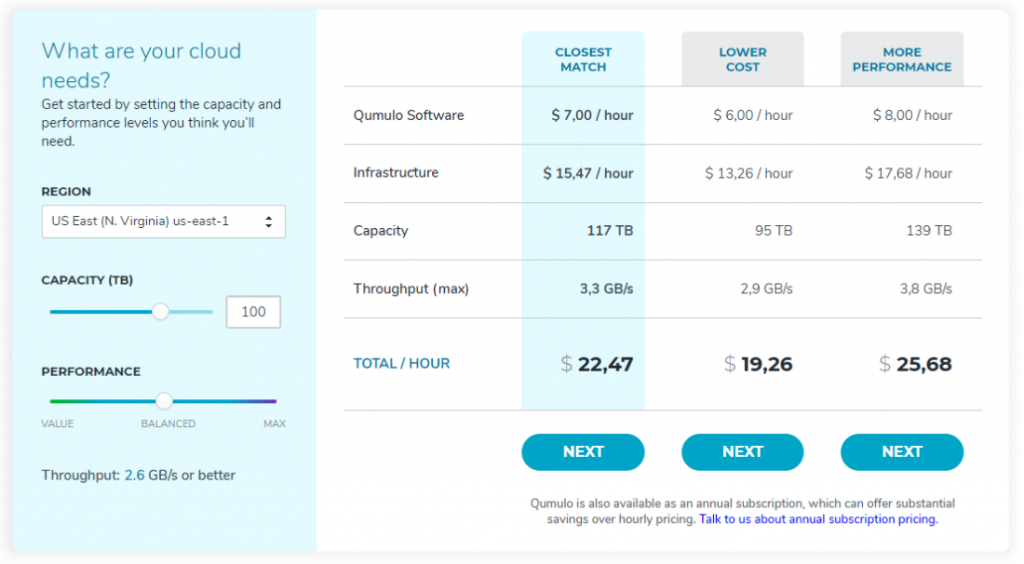
After a series of design iterations, Qumulo and TrackIt agreed on a user interface that incorporates all the necessary elements in a simple and appealing design.
The calculator’s interface allows users to select a region, enter their capacity requirements, and also customize their performance/throughput requirements. Users are then provided with three storage clusters to choose from:
1. Closest Match: The cluster that best matches the capacity and performance requirements
2. Lower Cost: The least expensive cluster that satisfies 90% of the capacity requirements
3. More Performance: The least expensive cluster that satisfies 130% of the performance/throughput requirements
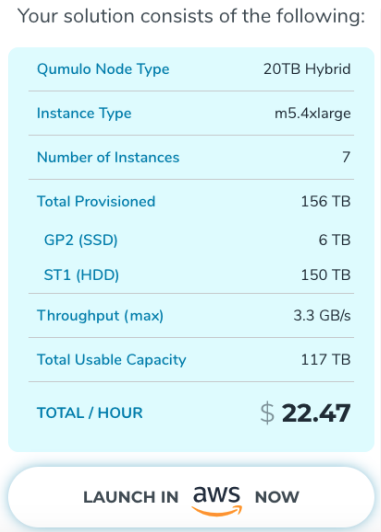
Upon clicking the ‘Next’ button, users are subsequently taken to a page where they can directly deploy their clusters on AWS by clicking on the ‘Launch in AWS Now’ button.
Solution Architecture
How The 3 Cluster Selections Are Provided
There are three parameters that users can choose in the calculator’s interface: Region, Capacity, and Performance (throughput). Based on these choices, three clusters are presented to the user:
● The Closest Match: This cluster is the best fit for the user’s requirements and is built by adding nodes until the minimum capacity and performance requirements chosen by the user are fulfilled.
● Lower Cost: This is the least expensive cluster among the three and is built by adding nodes until at least 90% of the capacity requirements chosen by the user are fulfilled.
● More Performance: This cluster is built by adding nodes until at least 130% of the performance/throughput requirements chosen by the user are fulfilled. By its nature it is the most expensive of the three.
The percentages 90% and 130% (used to build the ‘Lower Cost’ and ’More Performance’ clusters) were consciously chosen to provide users with a reasonable degree of flexibility while choosing their clusters.
Implementation Challenges
The algorithms for the calculator were derived from internal Qumulo spreadsheet-based tools and reimplemented in a cloud-native software architecture. However, the teams had to overcome challenges in fine-tuning the interface & making it responsive for users.
Requirement Sliders
There was quite a bit of conversation as to the method of inputting capacity and performance requirements. After investigating direct numeric entry, up/down arrows, etc., the use of sliders was chosen as the easiest-to-use and most intuitive interface while as a benefit providing useful feedback to scaling up and down to view the impact of changes in an immediate way.
The ‘Capacity’ Slider
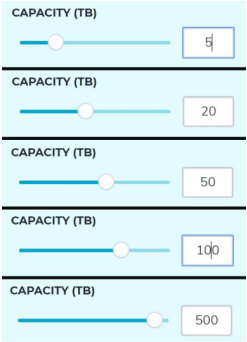
Qumulo chose a scale for the capacity slider which started at 1 TB and ended at 1000 TB. Qumulo clusters can scale quite a bit larger than 1000 TB of course, but the team felt that clusters that large would always be configured with the assistance of a Qumulo Solutions Architect, and outside the “general user” focus of the calculator.
Both teams agreed that more relative selection granularity was needed for capacity requirements that were between 1-100 TB than those needing a capacity between 100-1000TB. In order to address this disparity in distribution, it was important to ensure that a larger portion of the slider provides values in the 1-100 TB range. The solution was to choose a logarithmic scale for the capacity slider.
The ‘Performance’ Slider
The implementation of the performance slider proved to be even more tricky than the capacity slider. It had to meet two constraints:
First, It had to contain all throughput values associated only with capacities belonging to the interval [C, 2C], C being the capacity chosen by the user.
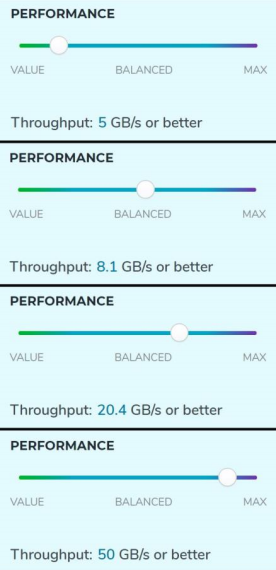
Second, the slider had to provide users with the flexibility to choose between three different levels of performance (Value, Balanced, and Max).
teams recognized that the differences between consecutive throughput values had to be much smaller on the [Value, Balanced] side of the slider and much larger on the [Balanced, Max] side. As a result, the challenge was to find the best way to distribute these throughput values across the slider.
Implementation
The first step in the implementation of the performance slider was to list all the possible values for performance. In order to do this, a JSON file named ‘performance’ was created. The ‘performance’ JSON is an array of arrays in which each cell is an array containing two values [capacity, throughput].
Throughput values are filtered as soon as the user chooses a capacity “C”. All throughput values associated with a capacity smaller than C are ignored and throughput values associated with a capacity larger than 2C are also ignored. As a result, what’s left is a complete list of throughput values associated only with capacities that belong to the interval [C, 2C].
Lastly, the distribution of these throughput values was implemented by dividing the slider into two halves (0-50 and 50-100) with two different scales:
● 0-50: Logarithmic A logarithmic scale was chosen for throughput values belonging to the [Value, Balanced] performance range.
● 50-100: Linear A linear scale was chosen for throughput values belonging to the [Balanced, Max] performance range.
AWS Infrastructure Prices
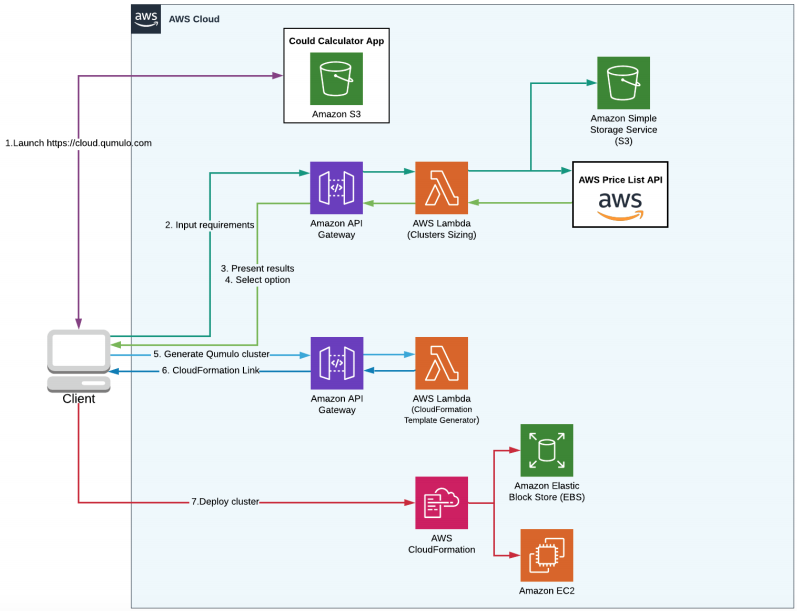
The constantly fluctuating infrastructure prices on AWS added an additional degree of complexity to the implementation of the calculator. In order to provide users with accurate cost estimates, the team had to find a way to access the live infrastructure prices on AWS. This was achieved using the AWS Price List API.
Finding a company that could meet the standards in sophistication of engineering design that is the hallmark of Qumulo solutions and associated tools was a challenge. TrackIt, with a history of UI/UX development and a blend of a collaborative approach and responsiveness brought the project to a level that exceeded initial expectations.
The communications between teams was facilitated by the use of joint communications tools resulting in TrackIt’s team acting as a virtual extension of Qumulo Engineering and Technical Marketing.
The end result of the development, after a short beta period, was the deployment of the Cloud Calculator within Qumulo’s landing page for its Cloud campaigns. The site serves as an accessible, user-friendly launching spot for users to take advantage of the unique value of Qumulo in the cloud.
TrackIt’s Combined Expertise In Storage, UI, Software Development, and AWS
TrackIt’s work with Qumulo highlights its ability to not only build friendly, functional yet sophisticated user interfaces, but to also combine in-depth storage knowledge with its expertise in Amazon Web Services, software development, and UI.
“TrackIt has a diverse skill set that supplemented our team’s ability to deliver innovative tools, helping us accelerate our development pipeline. Their agility as a business has assisted Qumulo in better serving our cloud customers and continued our rich history of innovation.”
– Molly Presley, Global Product Marketing
Challenge(s):
Building a cloud cost calculator that is:
1. Simple enough to be used by someone who’s not a storage or AWS expert
2. Flexible enough so that users can choose the stack that best matches their performance & budget constraints
Solution(s):
Cloud cost calculator UI that incorporates all the necessary variables in a simple and visually appealing design
Outcome(s):
A successfully launched cloud cost calculator that:
1. Is easy to use
2. Provides users with accurate cloud cost estimates
3. Provides users with multiple options to choose from based on their requirements
4. Allows users to deploy their infrastructure directly on AWS with a single click
About TrackIt
TrackIt is an international AWS cloud consulting, systems integration, and software development firm headquartered in Marina del Rey, CA.
We have built our reputation on helping media companies architect and implement cost-effective, reliable, and scalable Media & Entertainment workflows in the cloud. These include streaming and on-demand video solutions, media asset management, and archiving, incorporating the latest AI technology to build bespoke media solutions tailored to customer requirements.
Cloud-native software development is at the foundation of what we do. We specialize in Application Modernization, Containerization, Infrastructure as Code and event-driven serverless architectures by leveraging the latest AWS services. Along with our Managed Services offerings which provide 24/7 cloud infrastructure maintenance and support, we are able to provide complete solutions for the media industry.


